Southeast Asia’s markets,
in one clear view.
Track Singapore, Indonesia and the Philippines, plus commodities, crypto and global yield curves, with local news alongside every chart. One uncluttered workspace for USD 10 a month.
No Top-ups. No Add-ons. No Additional Cost.
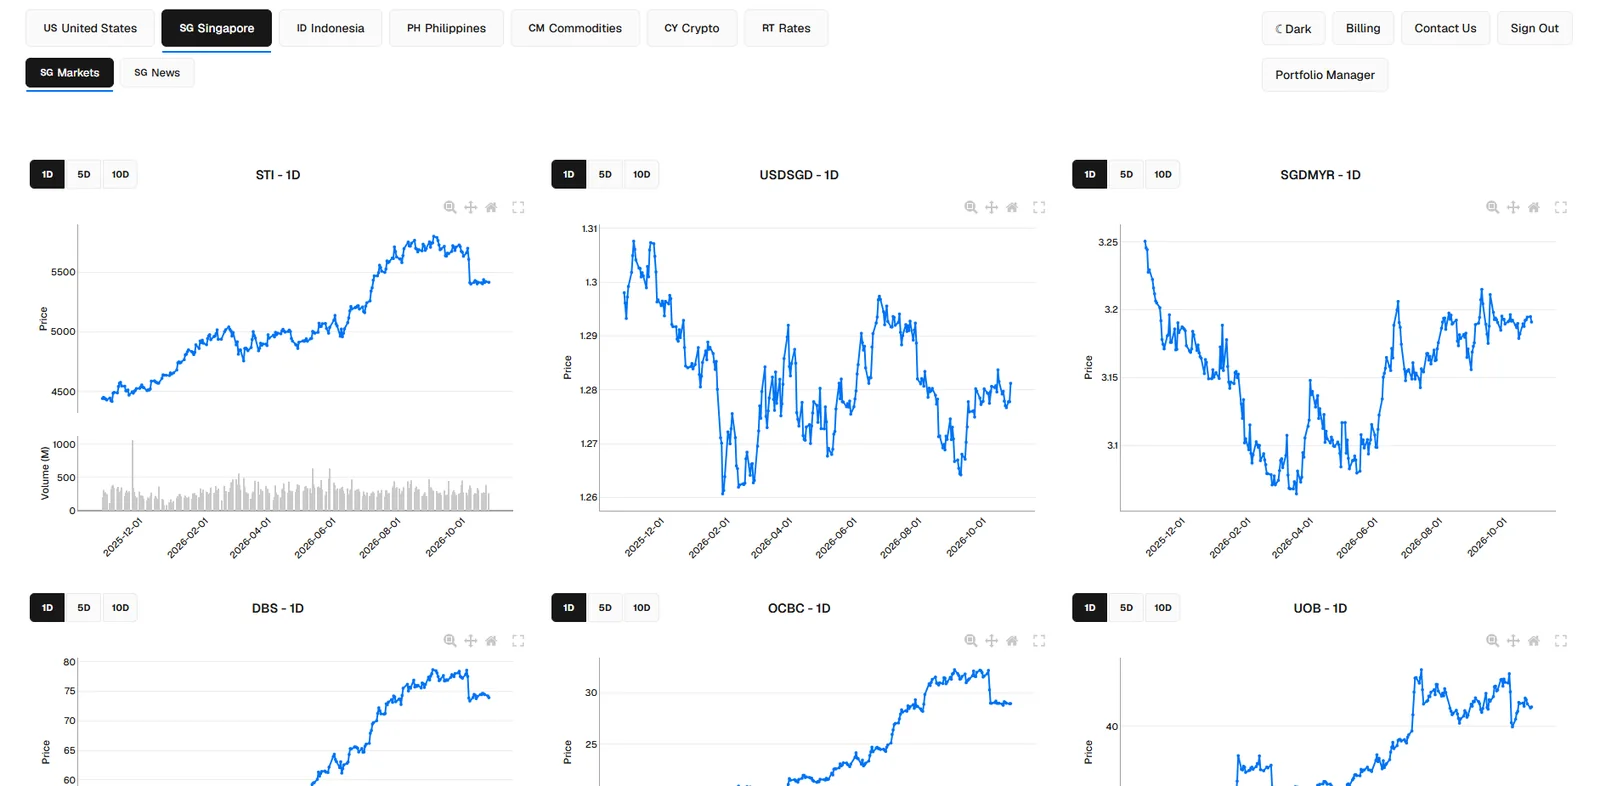
Platform preview · Market charts
- Singapore
- Indonesia
- Philippines
- Commodities
- Crypto
- Global yield curves
Closer to Southeast Asia
Follow regional markets and local developments without losing sight of the broader backdrop.
See the bigger picture
Place prices, rates and headlines side by side for a considered, bird’s-eye view.
Less clutter. More signal.
A streamlined interface keeps attention on information and comparisons.
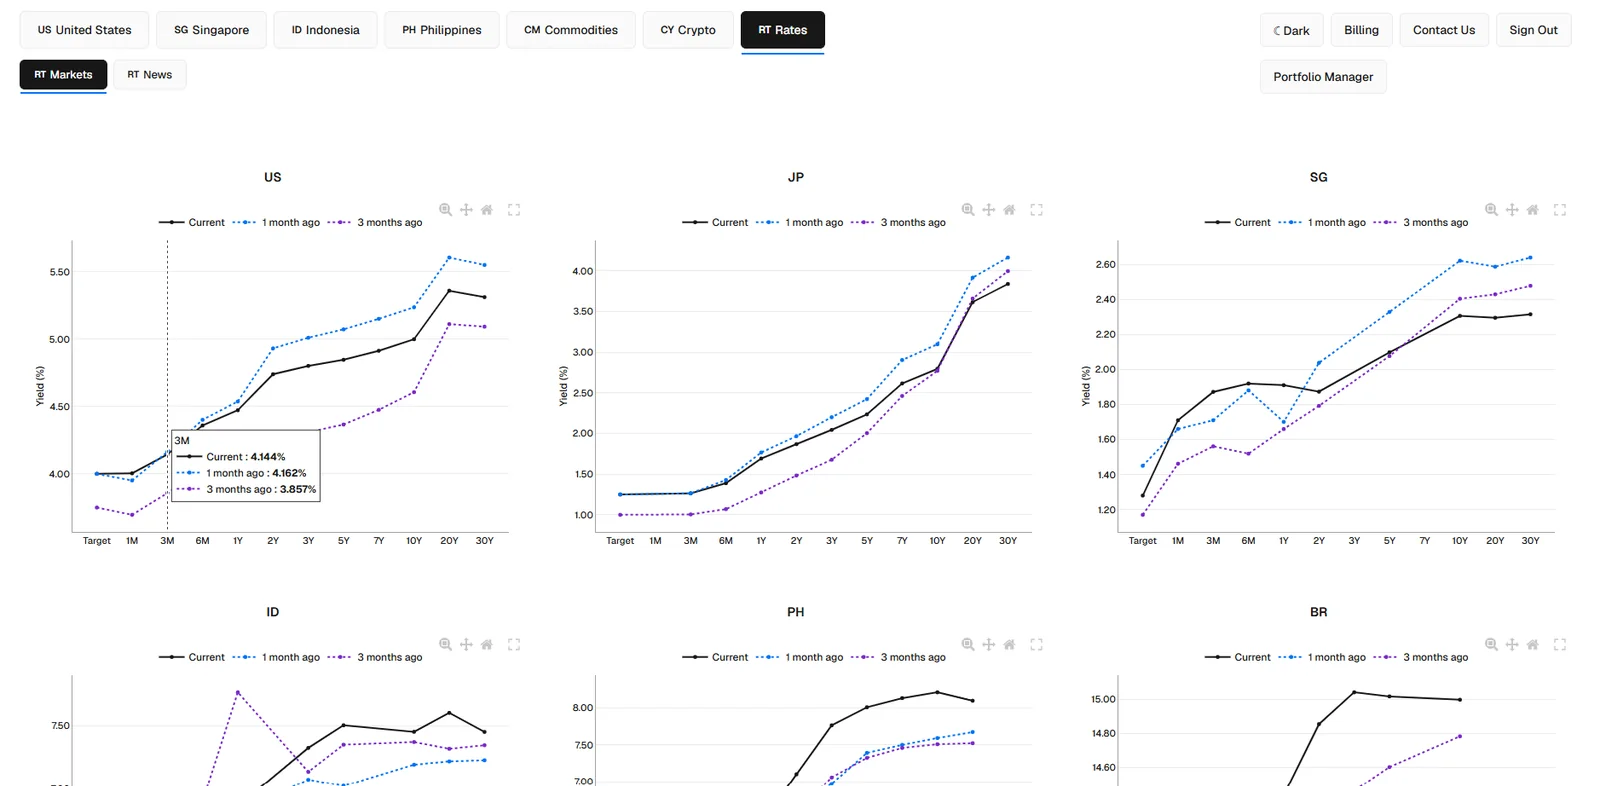
Comparable rate curves and historical perspectives within one analytical view.
Context that connects markets.
Move beyond isolated data points. Compare key market measures and interest-rate curves across countries, making local developments easier to place in context.
Cross-market comparison · Historical curve snapshots · Clear visual structure
Read broadly. Focus selectively.
Explore local financial news with headlines, concise previews and expandable detail. Scan developments across the region and follow the source when more context is needed.
Regional news · Article previews · Source links
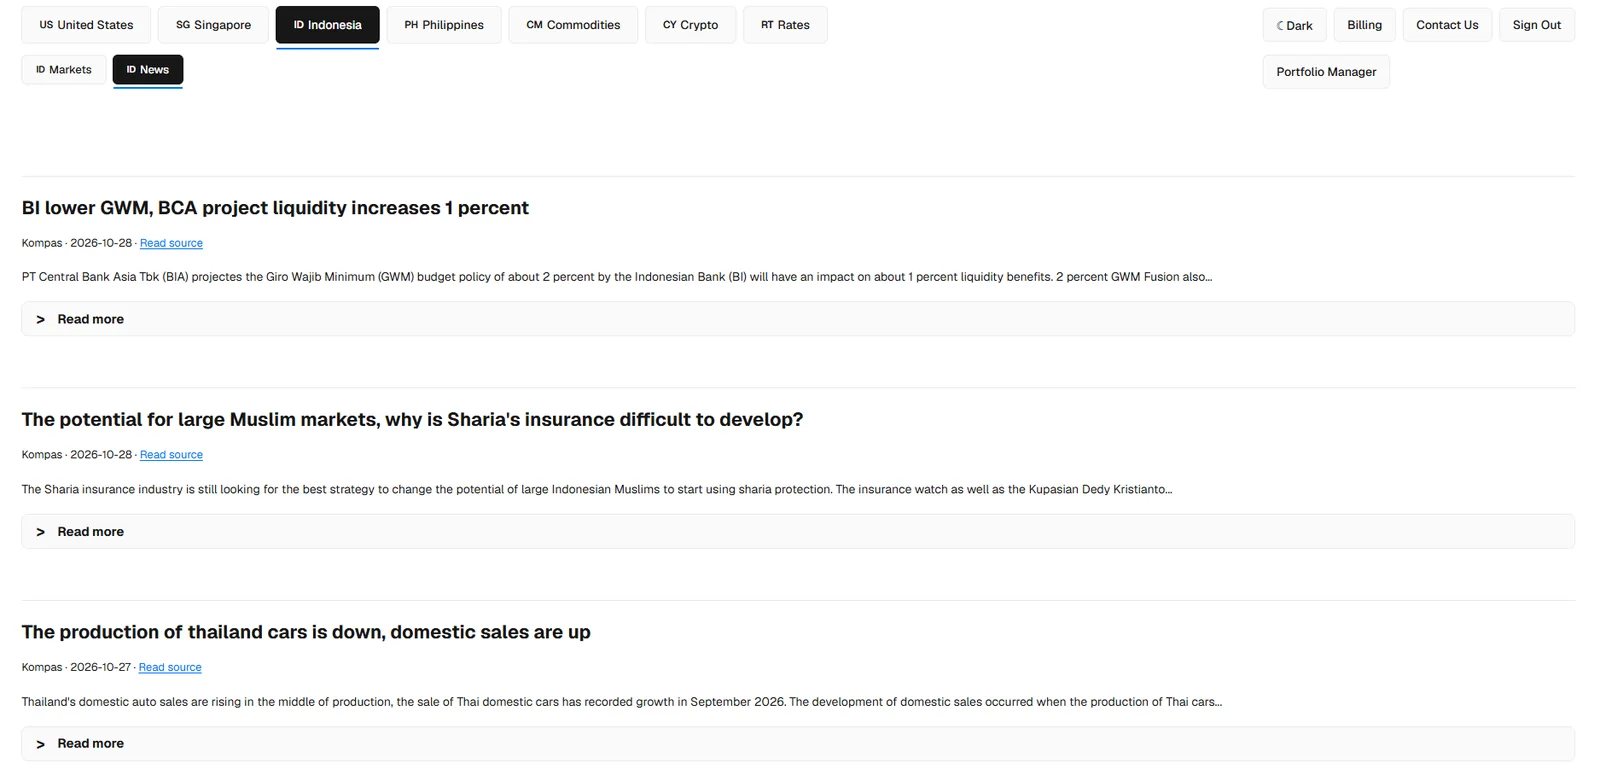
Relevant local news, presented for easy scanning and deeper reading.
Know how your portfolio is really doing.
Build portfolios from a ticker list or a CSV file and see their performance side by side, with risk, return and benchmark measures for each one. Plot portfolios against each other and compare with or without rebalancing.
Performance charts · Risk and return measures · Benchmark comparison
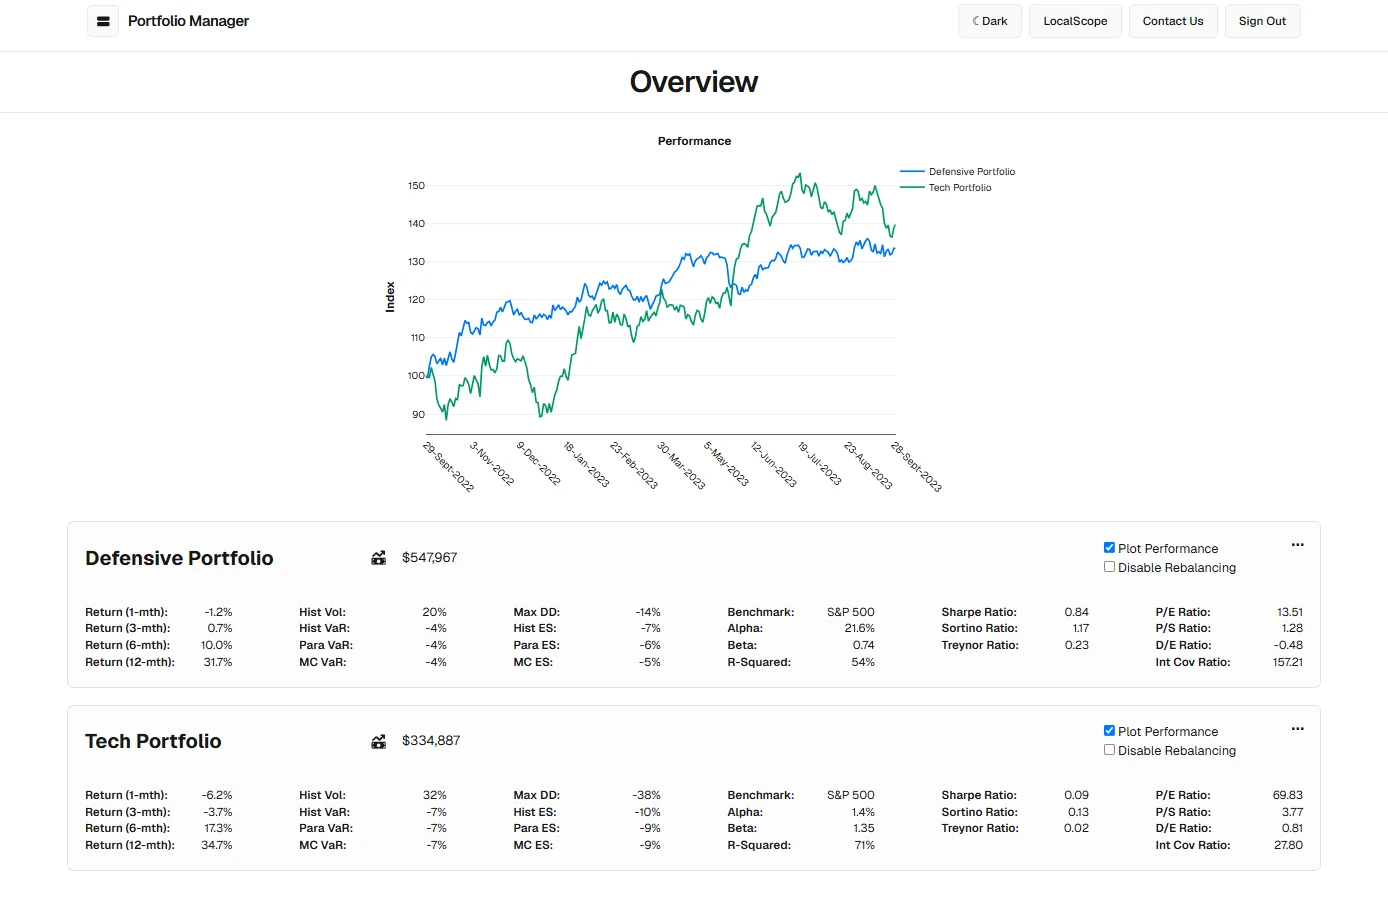
Every portfolio’s performance, risk and benchmark figures in one view.
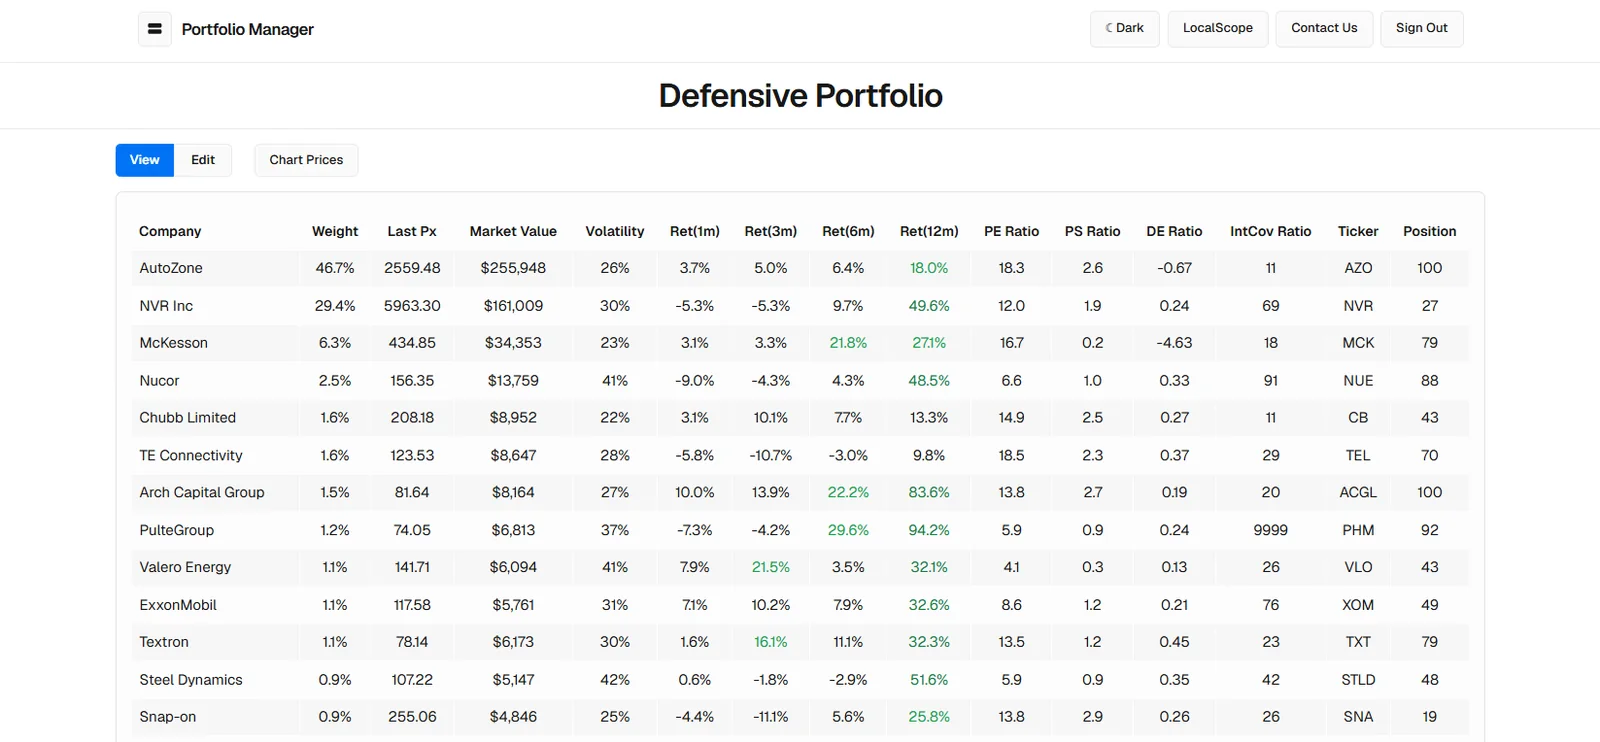
Weights, returns and valuation ratios for every position, sortable by any column.
Drill into each holding.
Open a portfolio to see each position’s weight, market value, returns and valuation ratios. Add or remove positions as your holdings change, and chart up to five holdings’ two-year price history in a click.
Sortable holdings · Add and remove positions · Price history charts · Included with your membership
A more considered way to follow the Southeast Asia region.
Explore LocalScope’s structured perspective on markets, rates and financial developments - USD 10 per month.
Free Trial · No Card NeededNo Top-ups. No Add-ons. No Additional Cost.
Already a member? Sign in